Implementation Trends
"Fuelbreak construction...on not less than 40,000,
but not more than 60,000, acres per year" Herger-Feinstein QLG Act
The Herger-Feinstein Quincy Library Group Forest Recovery act (HFQLG) and the Community Stability Proposal upon which it is based was designed and intended to implement a strategic fuelbreak system at a pace and scale to begin to address the threat of catastrophic, high-severity wildfires (see QLG fuelbreak strategy).
The scale of the program encompasses approximately 1.5 million acres within the Lassen and Plumas National Forests and the Sierraville Ranger District of the Tahoe National Forest. The HFQLG stipulates an implementation pace of 40,000 to 60,000 acres per year for 5 years.
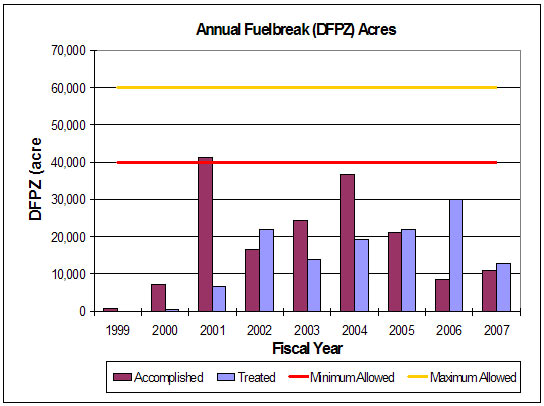
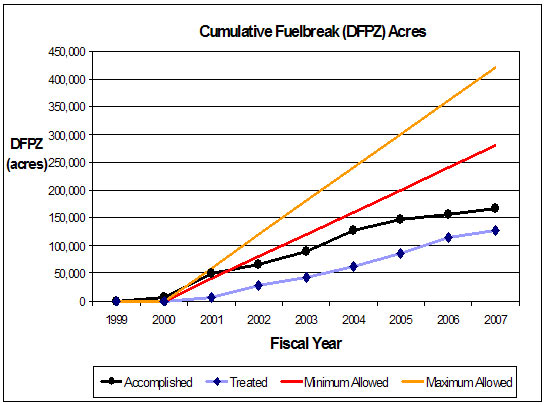
Figures 1 and 2, below, graphically show how far implementation is lagging behind the prescribed pace. There is only one year (2001) that the Forest Service was able to claim accomplishment of more than 40,000 acres per year. Actual construction of DFPZs exceeded 30,000 acres only once, in 2006. The Forest Service claims credit for accomplishment when a Record of Decision for a given project is rendered while implementation is actual on the ground treatment. Examination of Figure 2 suggests that until recently there is a lag of about 2 years between Forest Service Accomplishment reporting and actual treatment. Now projects seem to require at least 3 years from the Record of Decision to implementation. This lag is largely attributable to the appeals and litigation by NEPA activist groups.
 |
 |
|
| Figure 1- Annual Defensible Fuel Profile Zone (DFPZ) accomplished and treated. Source. | Figure 2- Cumulative Defensible Fuel Profile Zone (DFPZ) accomplished and treated. |
As of 2007, eight years after passage of the legislation, only 167 thousand acres have been treated. This represents 45 percent of the minimum allowed and only 30 percent of the maximum allowed. DFPZ acres accomplished and acres treated are not at all close to keeping pace with what is required by the HFQLG. In-other-words it will take more than 10 years to treat what should have been treated in 5 years.
Given the high priority for fuel reduction identified in the National Fire Plan and the increasing recognition and concern about catastrophic high-severity wildfires one might ask why implementation is not at maximum allowed treatment rate?
Uneven-age Silviculture- Group Selection Implementation
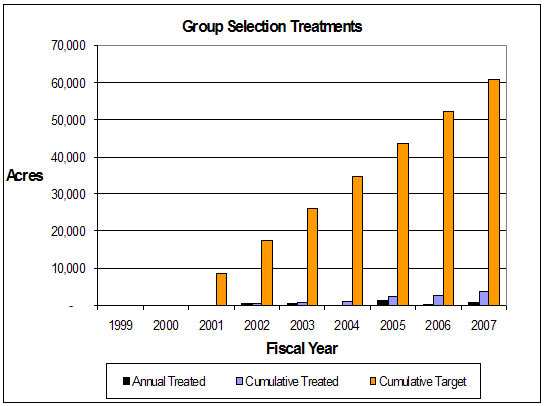 |
Figure 3- Group selection implementation trend. |
The HFQLG also stipulated the implementation of uneven-age silviculture using group selection. The pace of group selection implementation is lagging even farther behind the pace of fuel break development (Figure 3). Only 6 percent (2,700 of 42,000 acres) of group selection silviculture has been implemented over the 6 year period.
Why is implementation lagging?
There are 3 separate and sequential causes for HFQLG implementation lagging well behind the pace prescribed by the law and required to reduce fuel hazard and restore the forests to a fire resilient condition.
1. The HFQLG EIS in 1998 contained the so-called "mitigation". The HFQLG Environmental Impact Statement included the "mitigation" in the Record of Decision. The mitigation stated "At the site-specific project level, defensible fuel profile zones, group selection harvest areas, and individual tree harvest areas will be designed and implemented to completely avoid suitable California spotted owl habitat, including nesting habitat and foraging habitat". The concerns with the mitigation are described in the QLG appeal of the HFQLG EIS.
2. The 2001 Sierra Nevada Framework (Sierra Nevada Forest Plan Amendment) hampered implementation by constraining treatments so that they were not effective and not economically efficient. These issues are described in detail in the QLG's appeal of the decision. The fire and fuels aspect of the appeal are especially important.
3. The 3rd impediment to implementation is the strategy of the NEPA activist groups to appeal and litigate every HFQLG project (more). Each project specific appeal and litigation action stalls implementation from 2 to 3 years.
Economics
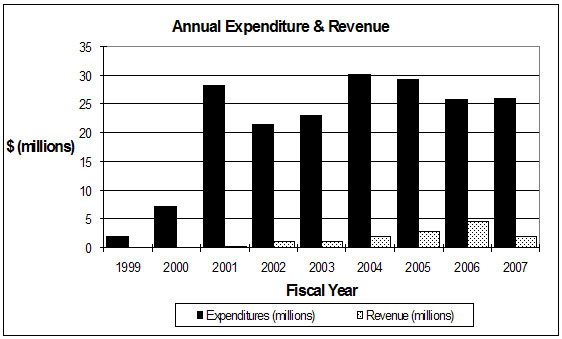
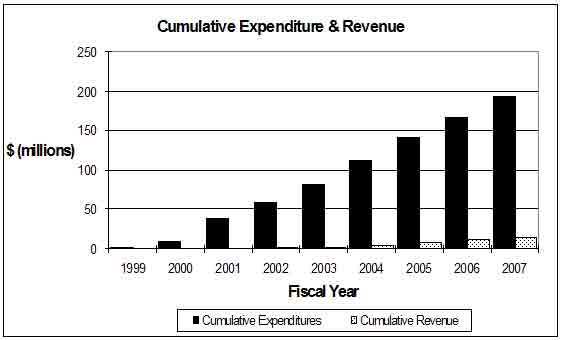
The HFQLG EIS forecast annual revenues of almost $21 million. After 9 years total expenditures are $193 million while cumulative revenues are only $13.6 million. The HFQLG EIS forecast a $3 to $1 ratio of revenues to expenditure. Instead the ratio is $0.07 returned for each $1 invested.
 |
 |
|
| Figure 4. Annual expenditures and revenues. | Figure 5. Cumulative expenditurs and revenues. |